
DataHub Project Updates
Data Engineering
Mlops
Metadata
Open Source
Project Updates


Data Engineering
Mlops
Metadata
Open Source
Project Updates

Community Update
We recently hit the milestone of 1000+ members in our Slack community. This combined with the increasing activity of 9+ companies contributing per month, more than 70+ people consistently attending our community town halls and the high quality conversations happening in our community, makes the DataHub community a really vibrant community of the best data practitioners in the world. I couldn’t be more excited about working with this community to continue building the best real-time metadata platform.
Project Update
We had 132 commits in July, continuing our 100+ commits/month rate. We had contributions from 16 different contributors from 9 companies (6 new contributors!).
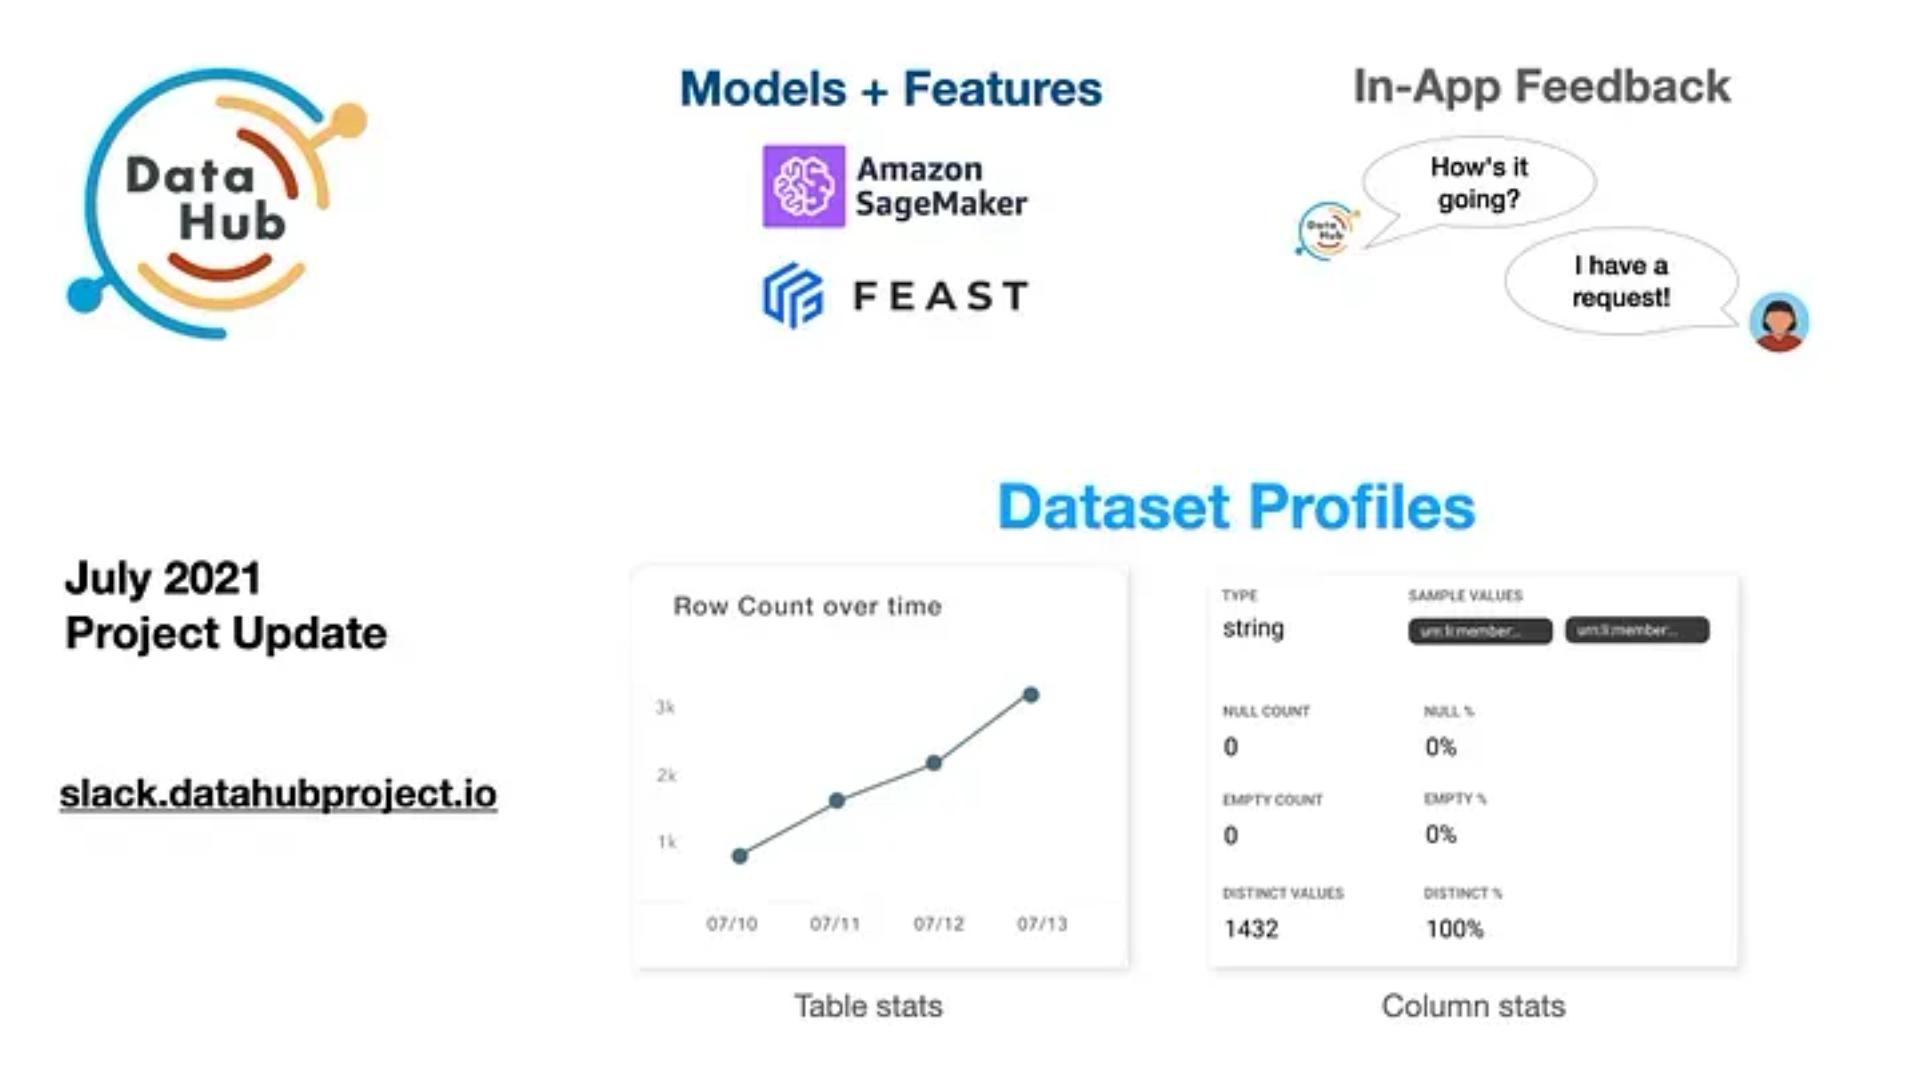
In our most recent monthly town-hall , we had over 70 attendees, where we shared the first phase of Data Observability features in DataHub, a demo from New York Times about In-App User Survey functionality that they are building and our continued progress into the MLOps ecosystem through the integration with AWS SageMaker. Join us on Slack and subscribe to our YouTube channel to keep up to date with this fast growing project.
The big updates in the last month were in two tracks:
Product and Platform Improvements
- Data Observability Phase 1 which allows visualizing how data is evolving over time using data profiling.
- DataHub + MLOps: AWS SageMaker integration
- Business glossary visualization from Saxo Bank (incubating)
Developer tooling and Operations Improvements
- Support for integration testing of the UI using Cypress
- A recipe for how to restore search and graph indexes based on primary data when indexes get corrupted.
- We heard from our community that there were scenarios where they accidentally ingested bad metadata or they overwrote good metadata that they no longer have access to. We now support the ability to rollback specific ingestion runs and delete specific metadata. Watch the demo here .
Read on to find out more about the July highlights!
Data Observability Phase 1
We polled the DataHub community in February to understand Data Observability pain points and we summarized the results in our April TownHall meeting. In phase 1, we rolled out support for data profiling and the ability to visualize profiling results over time. This allows for data producers to debug data incidents by inspecting how row counts and column distributions vary over time. Data consumers also benefit from more trust signals before they decide to use a particular dataset.
We integrate with Great Expectations to extract profiling information which works with all SQL-based data sources. You just need to set “profiling.enabled” to true in your ingestion config to get this new functionality. This required building the foundation for ingesting time-series metadata into DataHub since time based retention is hard to set up in MySQL, range queries and aggregations are less efficient in MySQL and the primary write path was not optimized for high-write throughput. We introduced the notion of “time-series aspects” for log-oriented data.


time-series aspects for log-oriented data
We added intuitive visualizations to consume the latest and historical profiling data.

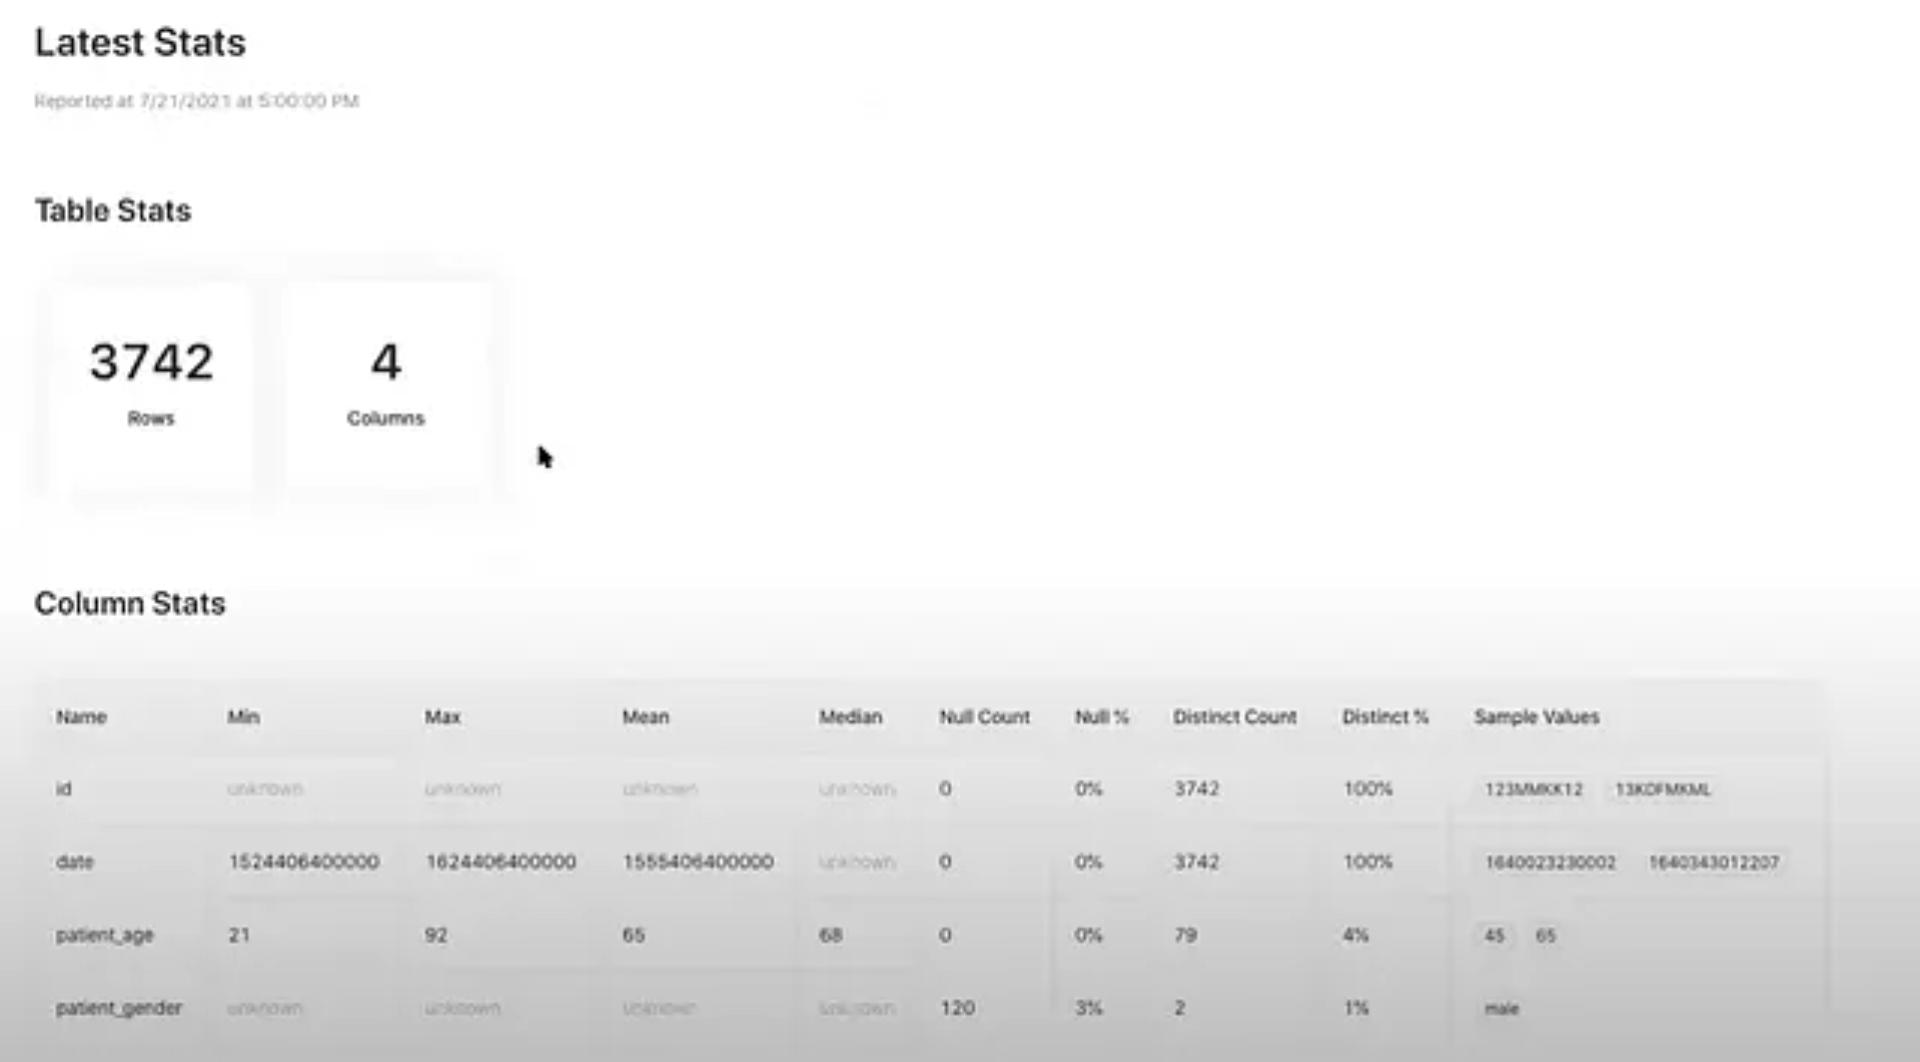
Datahub Latest Stats

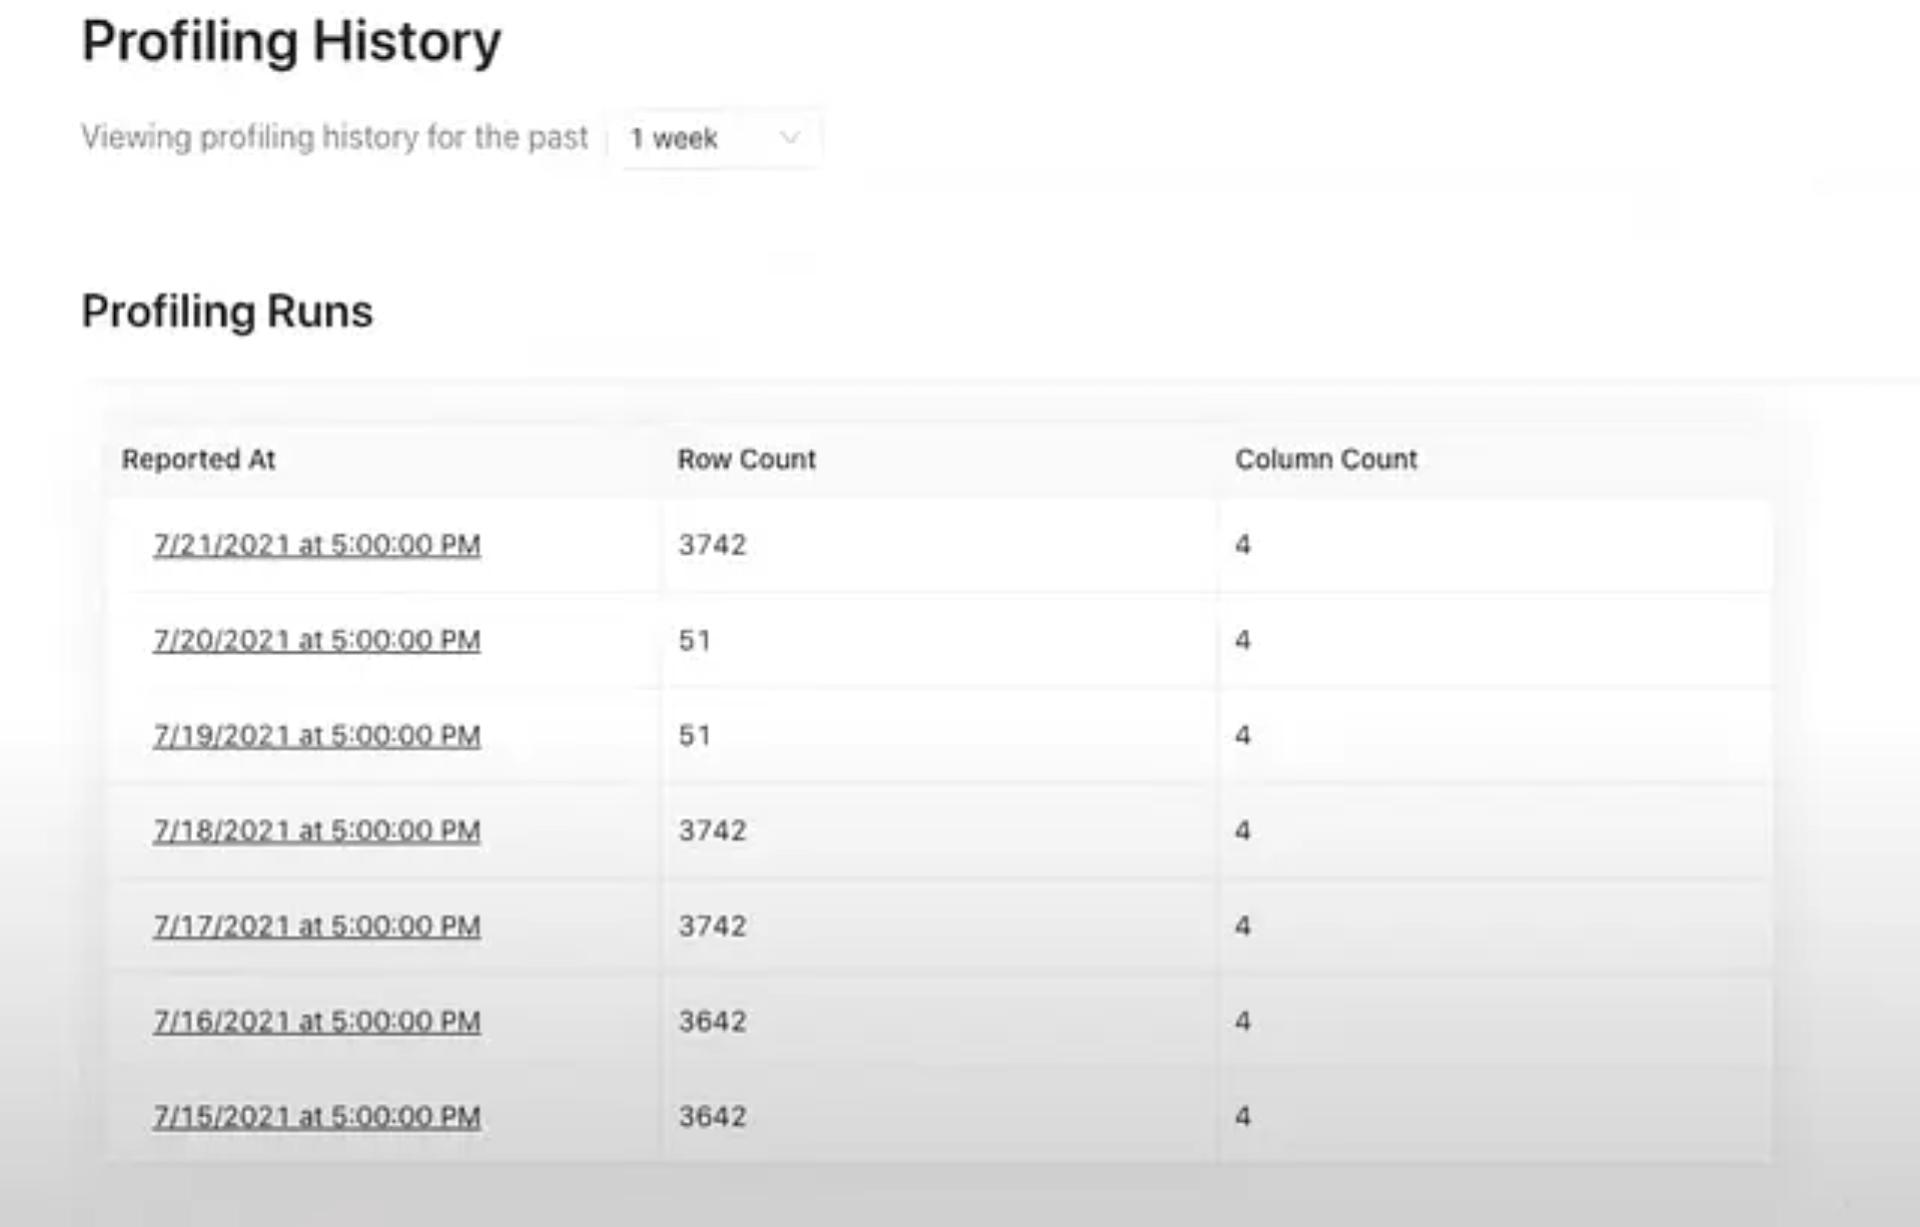
Datahub Profiling History


Datahub Historical Table Stats


Datahub Profiling History Stats
As next steps, we will look into making profiling more efficient (invoking it only for tables that are changing, making it more configurable etc.) and supporting data lake ecosystems. We will also utilize time-based profiling signals for providing insights about data quality and for search ranking.
You can watch the full video of John Joyce demo-ing the feature and design decisions in the town-hall video below:
DataHub + MLOps: AWS SageMaker integration
Modern data science aims to leverage machine learning and artificial intelligence to automate and solve complex tasks. This elaborate process often requires the coordination of several datasets, workflows, models, and deployments, each with its own intricacies. ML models in particular are associated with a wealth of metadata — features, hyper-parameters, and training metrics are all integral to determining a model’s usability and performance. Even after vetting and deployment, models have to be continuously tracked and monitored for signs of drift and decay. To meet these needs, the field of MLOps (machine learning operations) has emerged with a set of practices for designing and deploying ML workflows. MLOps principles form the foundation of platforms aiming to deliver a tailored experience for the data science workflow. In speaking with our users, we found that many wished to see support for AWS SageMaker , Amazon’s hosted platform for developing and deploying ML.


Amazon SageMaker Studio
In our survey of SageMaker’s components, we found three basic building blocks: feature stores, jobs, and ML models. We added a metadata connector for SageMaker to extract these entities and added intuitive visualizations.


SageMaker’s components


Sagemaker's components
As for all of our ingestion docs, we’ve added a guide on how to get started with SageMaker ingestion here


Sagemaker code
Watch Kevin Hu describe how he extended the metadata model and implemented this feature (no puns intended!) and a quick demo of the integration in the town hall video.
Future improvements include completing the lineage graph to include the edge between feature tables and models and ingesting more metadata related to ML experiments.
Looking Ahead
The next phase of Data Observability involves connecting more operational metadata streams to DataHub and continuing to build out observability related items on our roadmap . We are working hard on landing better support for user/group management and the first milestone for role-based access controls based on the RFC. We are also looking forward to releasing Business Glossary as a fully supported feature in the upcoming release. Until next time!
Data Engineering
Mlops
Metadata
Open Source
Project Updates

NEXT UP
Governing the Kafka Firehose
Kafka’s schema registry and data portal are great, but without a way to actually enforce schema standards across all your upstream apps and services, data breakages are still going to happen. Just as important, without insight into who or what depends on this data, you can’t contain the damage. And, as data teams know, Kafka data breakages almost always cascade far and wide downstream—wrecking not just data pipelines, and not just business-critical products and services, but also any reports, dashboards, or operational analytics that depend on upstream Kafka data.

When Data Quality Fires Break Out, You're Always First to Know with Acryl Observe
Acryl Observe is a complete observability solution offered by Acryl Cloud. It helps you detect data quality issues as soon as they happen so you can address them proactively, rather than waiting for them to impact your business’ operations and services. And it integrates seamlessly with all data warehouses—including Snowflake, BigQuery, Redshift, and Databricks. But Acryl Observe is more than just detection. When data breakages do inevitably occur, it gives you everything you need to assess impact, debug, and resolve them fast; notifying all the right people with real-time status updates along the way.


John Joyce
2024-04-23

Five Signs You Need a Unified Data Observability Solution
A data observability tool is like loss-prevention for your data ecosystem, equipping you with the tools you need to proactively identify and extinguish data quality fires before they can erupt into towering infernos. Damage control is key, because upstream failures almost always have cascading downstream effects—breaking KPIs, reports, and dashboards, along with the business products and services these support and enable. When data quality fires become routine, trust is eroded. Stakeholders no longer trust their reports, dashboards, and analytics, jeopardizing the data-driven culture you’ve worked so hard to nurture
John Joyce
2024-04-17