
Metadata Analytics from DataHub
Metadata
DataHub
Analytics
Data Infrastructure
Data


Metadata
DataHub
Analytics
Data Infrastructure
Data
Contemporary data stacks involve a myriad of specialized platforms and technologies, each with their differentiated use-cases and functions, making it cheaper and easier than ever to store, transform, and leverage data. The downside to this hyper-fragmented tooling is the complexity that arises when data practitioners attempt to govern data across this ever-growing set of resources:
- Who owns what?
- What does this data asset represent?
- How should this data be leveraged?
- How are core metrics and measures defined?


Data Landscape Summary
DataHub’s Analytics gives the organization a birds-eye view of the volume of data assets across Domain, Platform, and Terms, as well as a snapshot of metadata coverage by entity type. This is very useful to monitor and measure the impact of initiatives to increase data ownership, documentation, and more.


The Data Landscape Summary provides a quick breakdown of the number of Entities by Domain, making it easier than ever to track the progress of assigning Data Domains to you assets while rolling out Data Mesh practices.
Users can also view how data is organized and categorized throughout and organization’s data stack by viewing the breakdown of entities by Platform (i.e. Snowflake, Looker, dbt) or Glossary Term.
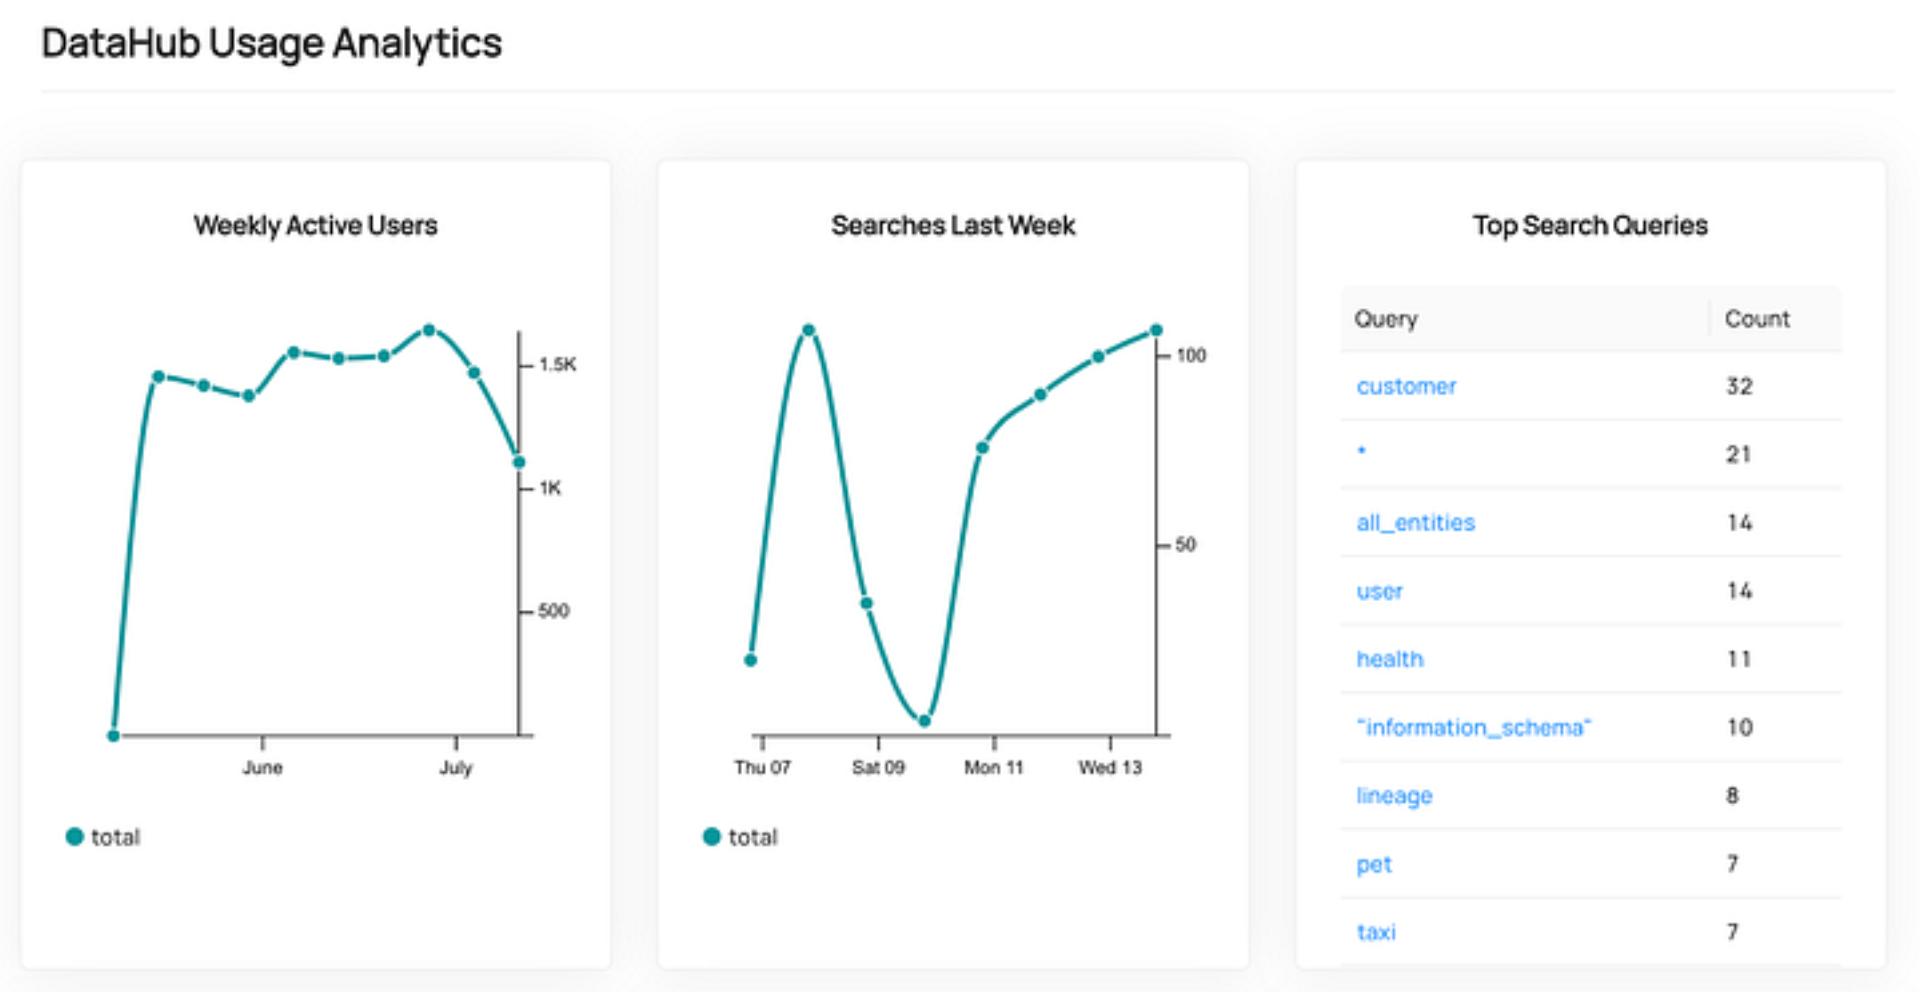
DataHub Usage Analytics
Another facet of DataHub’s Metadata Analytics is a summary view of how DataHub user are interacting with the tool. Easily understand how widely adopted DataHub is within your organization by looking at Weekly Active Users and Number of Searches performed over time.

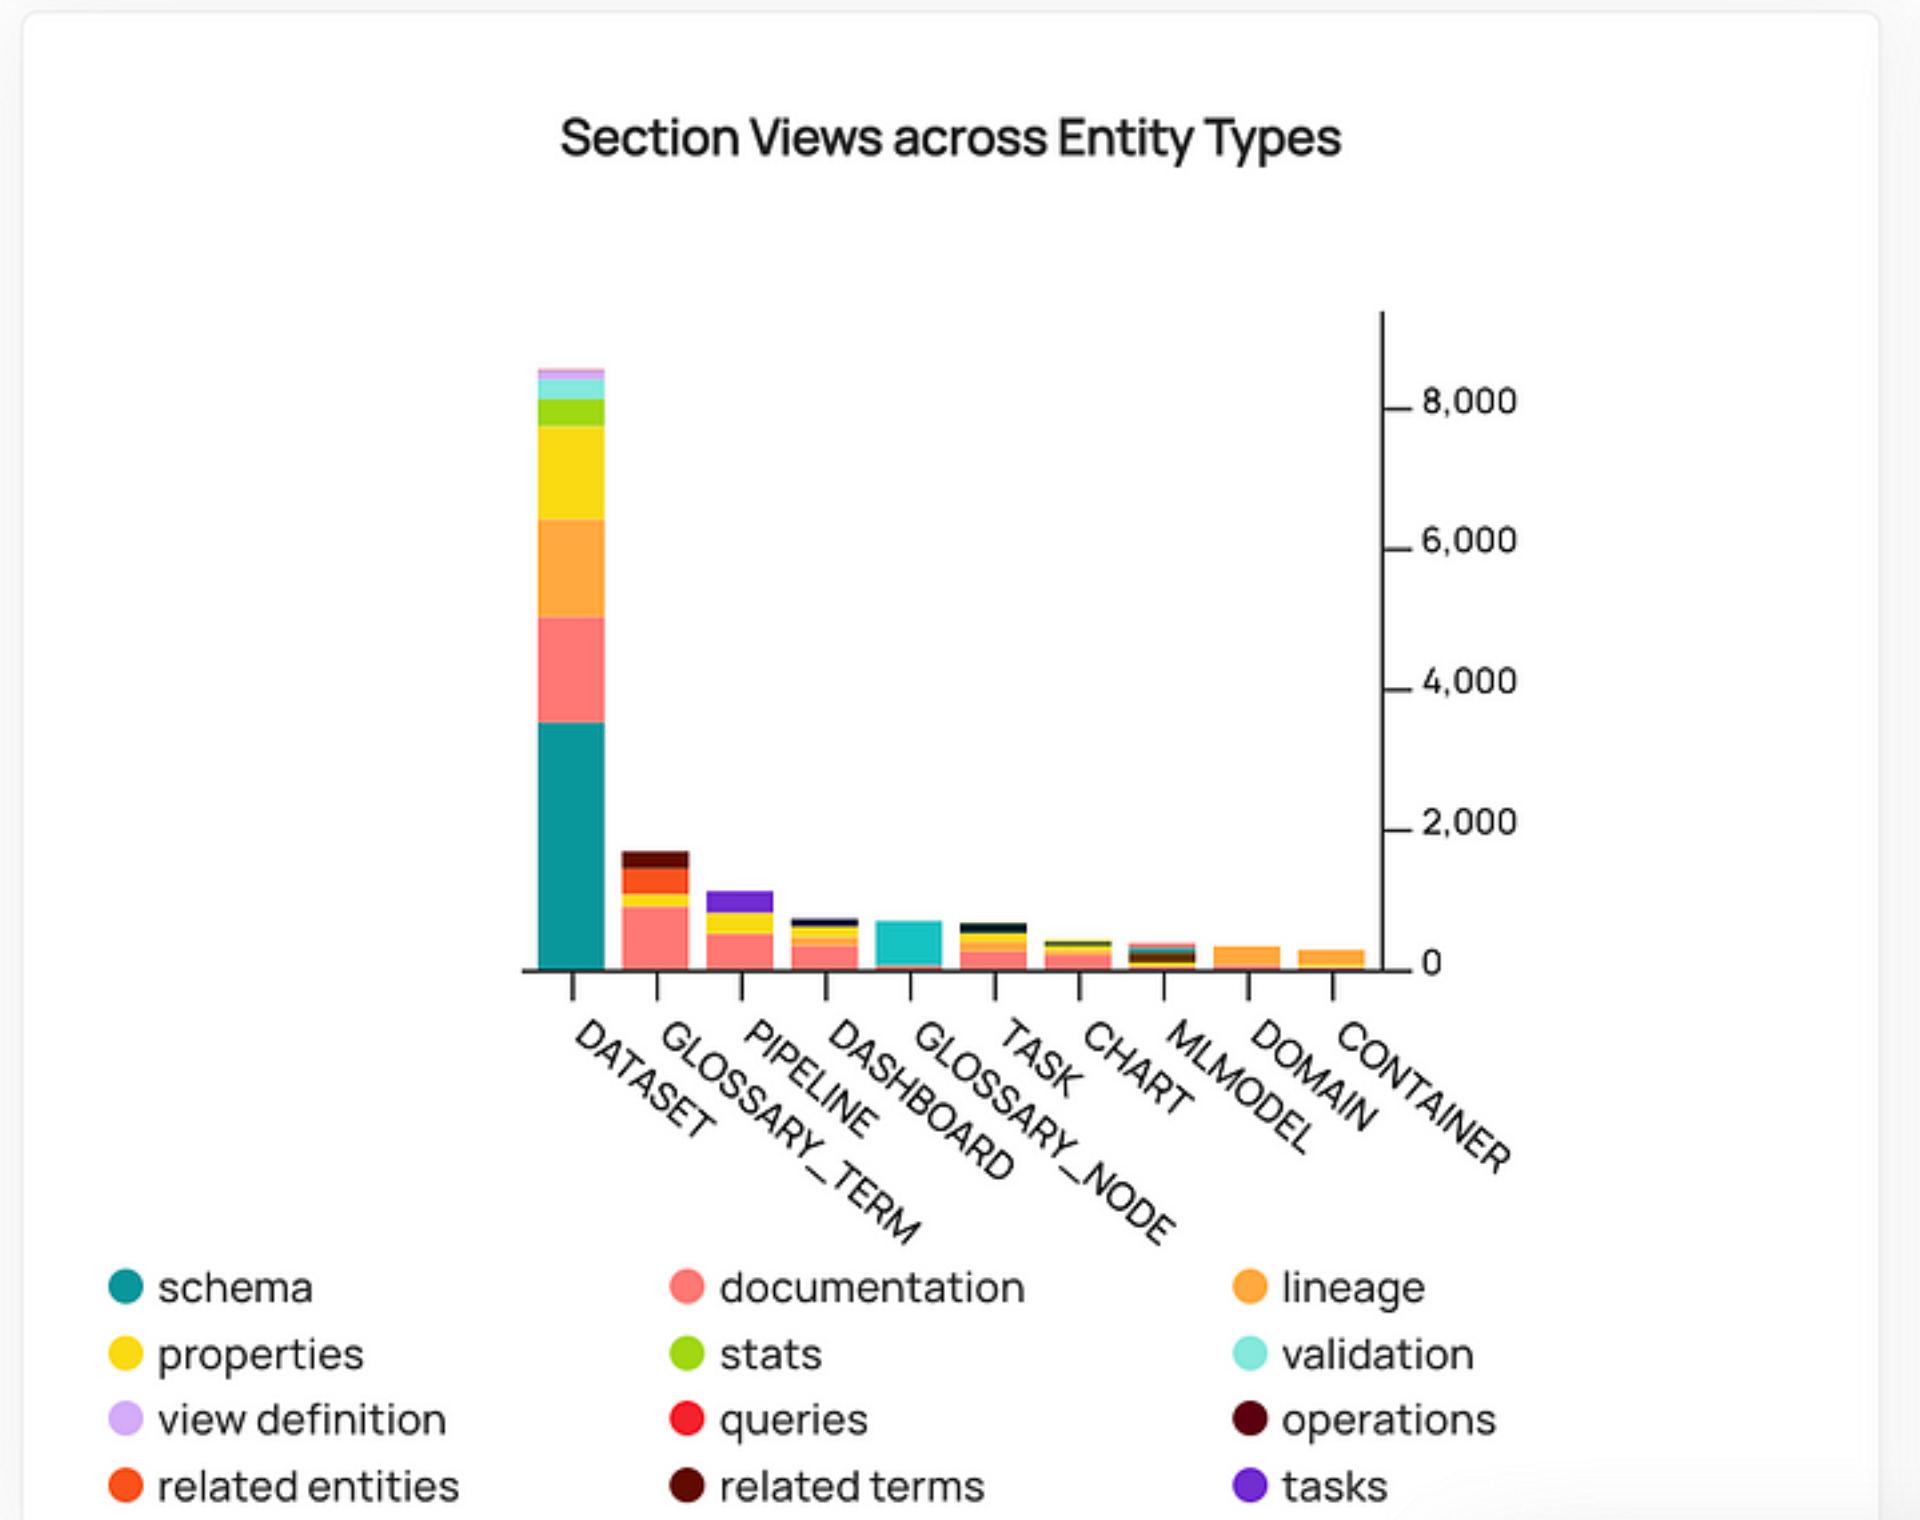
Quickly gain insight into how DataHub users are interacting with the platform by seeing which functionality is most commonly adopted, and which actions users are taking. For example, we see in this graph that end-users are most commonly interacting with Dataset entities within DataHub, most commonly viewing the Schema, Documentation, and Lineage sections.

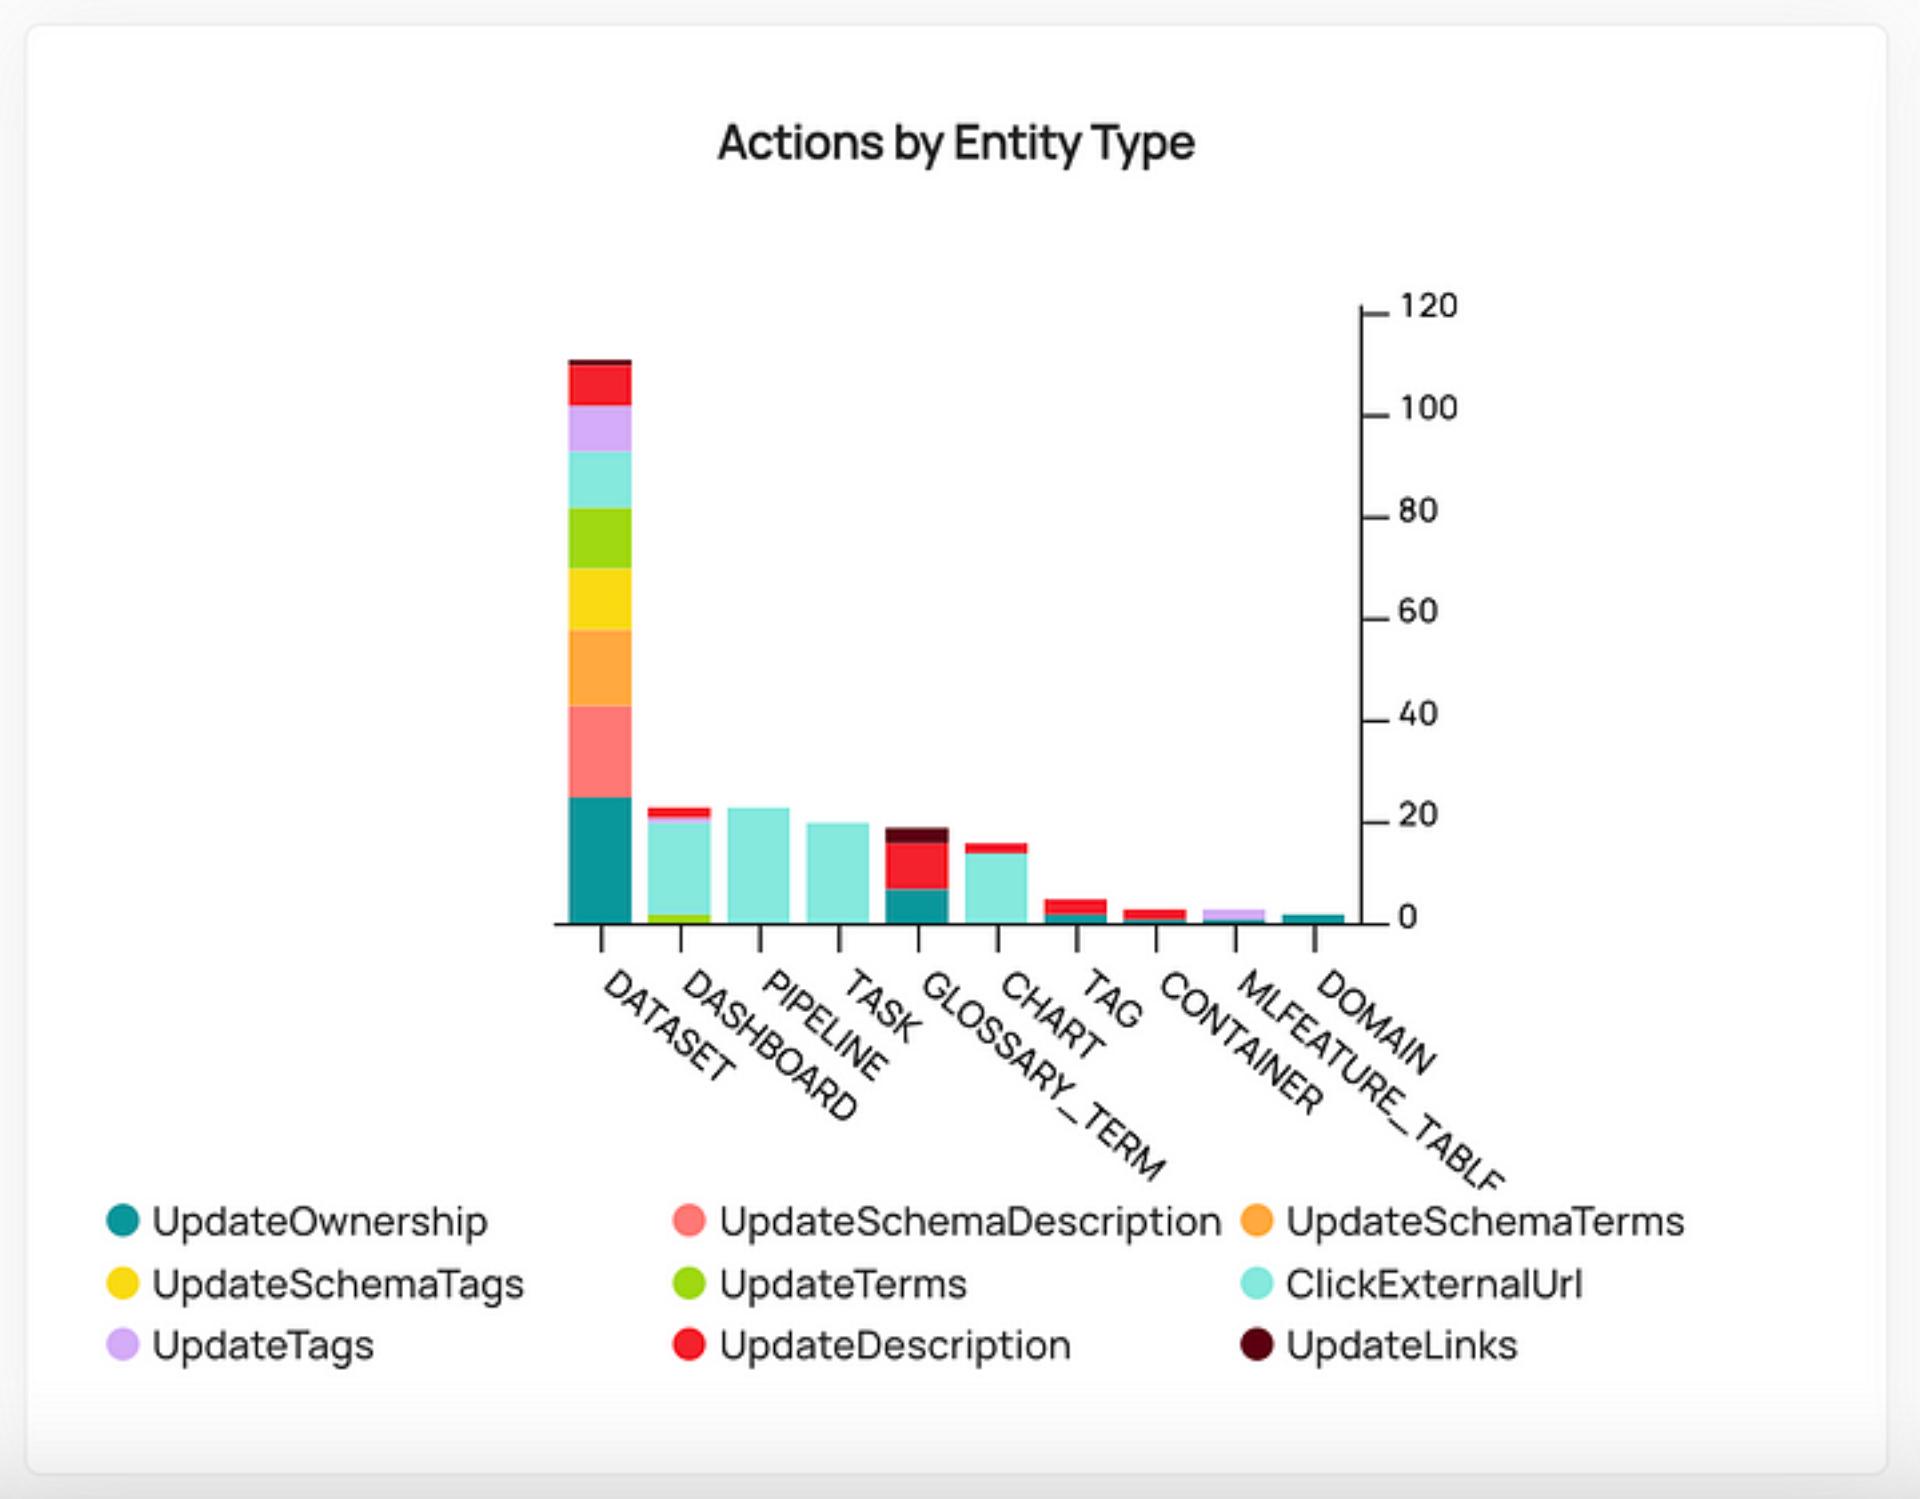
Looking at the actions taken by DataHub users, we can see some pretty interesting differences in activity based on Entity Type. For example, users are commonly updating Ownership, Description, and Terms for Datasets, but primarily interacting with External Links for Dashboards/Charts and Pipelines/Tasks.

Interested…? Understand Your Data Ecosystem using Analytics with DataHub!
DataHub’s mission is to empower how organizations understand and utilize their data through sophisticated metadata management. DataHub is building tools and features for governance, discovery, and observability for the modern data ecosystem. We’d love you to be a part of the DataHub Community! Come say hello in our Slack, check out our Github and view our latest Town Hall to learn about the latest in DataHub.
Thanks to
Maggie Hays for being the co-author and editor of this article!
Metadata
DataHub
Analytics
Data Infrastructure
Data

NEXT UP
Governing the Kafka Firehose
Kafka’s schema registry and data portal are great, but without a way to actually enforce schema standards across all your upstream apps and services, data breakages are still going to happen. Just as important, without insight into who or what depends on this data, you can’t contain the damage. And, as data teams know, Kafka data breakages almost always cascade far and wide downstream—wrecking not just data pipelines, and not just business-critical products and services, but also any reports, dashboards, or operational analytics that depend on upstream Kafka data.

When Data Quality Fires Break Out, You're Always First to Know with Acryl Observe
Acryl Observe is a complete observability solution offered by Acryl Cloud. It helps you detect data quality issues as soon as they happen so you can address them proactively, rather than waiting for them to impact your business’ operations and services. And it integrates seamlessly with all data warehouses—including Snowflake, BigQuery, Redshift, and Databricks. But Acryl Observe is more than just detection. When data breakages do inevitably occur, it gives you everything you need to assess impact, debug, and resolve them fast; notifying all the right people with real-time status updates along the way.


John Joyce
2024-04-23

Five Signs You Need a Unified Data Observability Solution
A data observability tool is like loss-prevention for your data ecosystem, equipping you with the tools you need to proactively identify and extinguish data quality fires before they can erupt into towering infernos. Damage control is key, because upstream failures almost always have cascading downstream effects—breaking KPIs, reports, and dashboards, along with the business products and services these support and enable. When data quality fires become routine, trust is eroded. Stakeholders no longer trust their reports, dashboards, and analytics, jeopardizing the data-driven culture you’ve worked so hard to nurture
John Joyce
2024-04-17